Every January, government officials, urban dwellers, and rural families across the state of Ceará, Northeast Brazil anxiously await the rainy season forecasts from Funceme, the Research Institute for Meteorology and Water Resources of Ceará. Yet throughout the state, many also proclaim that Funceme’s forecasts are “wrong,” that the forecasts do not work.
Dona Maria, who lives in a rural community in the municipality of Piquet Carneiro, explained it this way: “The problem with Funceme is this: sometimes it doesn’t work. Here, if I have a… how do you say… a forecast from Funceme, it can work in another municipality. Here it doesn’t work. Funceme predicts rain, for example. But then it rains there. In Juazeiro do Norte, it rains. It doesn’t rain here in Piquet Carneiro. It rains there in Barbalha and Várzea Alegre. And here it doesn’t even drizzle, you know? And that’s why I don’t give it a lot of importance. Do you understand?” (Dona Maria, personal communication, March 7, 2022).[1]
But what does it mean that a forecast is wrong?
Indicating more general rainfall patterns, Funceme’s seasonal forecasts consist of a distribution of probabilities of rainfall below, at, or above the mean for a large geographic region. Because a forecast is a distribution of probabilities, technically, a forecast cannot be “wrong,” though its performance may be evaluated over a period of years. Models may indicate that there is a greater chance of rainfall above average, but lower rainfall levels are still possible. At the same time, forecasts are not made at the household or community-level but rather at the regional level, where a region may be a state or larger geographic area. However, for agricultural families in the sertão, or hinterlands, of Ceará, a forecast is wrong when it rains less (or more) in their community or municipality than what was “promised” by the forecast, and the highest probability becomes deterministic at a very fine scale. That is why for Dona Maria, Funceme’s forecasts work in some areas but not in others.
In this post, I explore the evolution of Funceme and its seasonal forecasting in Ceará, where drought is integral to the collective socioecological memory (Alburque Jr. 1994, 2004; Seigerman et al. 2021). The majority of Ceará forms part of the Brazilian semi-arid region, characterized by distinct rainy and dry seasons, low rainfall levels, and high evaporation rates (de Souza Filho 2018). The droughts of 1877–1879, 1915, 1931, 1973, 1983, 1993, and 1998 evoke memories of unequal suffering in the Cearense sertão, as well as the implementation of large-scale infrastructure solutions in response to drought. The most recent drought (2012 to 2018) is considered the worst drought in Ceará’s history (Marengo, Torres, and Alves 2017).[2] While mortality and migration due to drought have declined dramatically in recent decades, in part due to government conditional cash transfer programs (Nelson and Finan 2009), “crises of collective anxiety about the rainy season” occur frequently and are often provoked by the communication of climatic information (Taddei 2008, 79).[3]
The Imaginary of Funceme
In 1987, Ceará restructured the Secretariat of Water Resources (SRH), and Funceme went from the Foundation of Meteorology and Artificial Rain of Ceará to the Research Institute for Meteorology and Water Resources of Ceará.[4] This name change, fifteen years after Funceme was founded, signified a transition from Funceme as an institution focused on experimental artificial rain production to one whose focus was “water in a general sense” (F. L. Viana, personal communication, August 19, 2022).[5] It has evolved as an innovative institution that advances forecasting modeling, basic environmental studies, and research on sociohydrologic dynamics. These advancements are not linear but rather have been achieved through efforts of Funceme’s most recent presidents, who were tasked to justify Funceme’s role as a research institute after the president from 1995 to 2001 almost dissolved Funceme with his business-like model for the research institute (E. S. P. R. Martins, personal communication, October 25, 2022). Today, government and non-government institutions, from regional to international levels, applaud Funceme. However, Funceme’s innovative character is often overshadowed in rural Ceará by the worry surrounding rainy season predictions.[6]
Since the 1970s, hydrologists have made significant progress in understanding the systems that shape the rainy season in Northeast Brazil, including the Intertropical Convergence Zone (ITCZ), a coupled atmosphere-hydrosphere system in the Atlantic (Hastenrath and Heller 1977, Hastenrath and Greischar 1993).[7] Yet, only in the past couple of decades have researchers at Funceme and around the world developed models to make quantitative forecasts. In its early forecasting years, Funceme employed a climate monitor that used qualitative indicators, including Atlantic and Pacific Ocean conditions, global circulation patterns, and regional studies, to visualize three scenarios without indicating probabilities: rainfall below, at, and above the historic mean (personal communication, F. L. Viana, August 19, 2022). Throughout the 1990s and early 2000s, forecasting methods advanced globally, with consensus forecasting as the norm.[8] Funceme has actively contributed to advancements, including the development of seasonal climate forecasts using dynamical downscaling in 1998-1999, the first operational forecast being launched in 2001 (personal communication. E. S. P. R. Martins, October 25, 2022). Dynamic downscaling, also called regionalization, resolves global-scale weather conditions at a finer scale to create more spatially detailed climate information.
Funceme broke conventions by adopting an objective forecast system in 2012 (personal communication. E. S. P. R. Martins, October 25, 2022). It gained independence in forecast production, running the ECHAM4.6 model (an atmospheric general circulation model) and adopting a thirty-year hindcast (1981 to 2010) for its ECHAM4.6 and RSM97 models. Sea surface temperatures were incorporated into the ECHAM4.6, and scenarios were run to better communicate forecast uncertainties. Concurrently, Funceme contributed to a national climate model superset, which helped Funceme establish itself as a national forecasting leader.[9] Today, Funceme uses probabilistic forecasting, which provides the probability that an event (rainfall) of a specific or range of magnitudes may occur in a specific region (the state of Ceará) in a particular time period (a trimester). However, despite forecast improvements, whether these innovations lead to better informed decisions is not clear. Decisions may depend not only on the forecast’s objectivity but also factors including users’ understanding of uncertainty in forecasts, personal or professional interests, and how available information is applied (Morss et al. 2008).
Communicating Forecasts
Salience, relevance, authority, and legitimacy are key to the uptake of forecast information by different actors (Taddei 2008). In part, Funceme establishes authority and legitimacy during forecast meetings using graphs that depict forecast model results. Data visualization is a discursive tool for social semiotics (Aiello 2020), as seemingly simple charts substantiate the presented rainfall probabilities. Model complexity, the immense quantity of atmospheric and other environmental data, and fluxes of ambient conditions are flattened into digestible nuggets for non-experts.
At this year’s forecast announcement, Funceme’s president, Dr. Eduardo Sávio P. R. Martins, used a pizza analogy to explain the anxiously awaited rainfall probabilities. As of January 20, the climate forecast indicated probabilities of 10:40:50 (10 percent below average, 40 percent around average, and 50 percent above average). Martins had the audience imagine these probabilities as portions of a pizza: cutting the pizza in half gives 50 percent of the pizza as above-average rainfall. The other half, divided into parts proportional to 40 and 10 percent, represents the other probabilities. Rotating the pizza, you can pick a slice from any of the three options. Rotating it again, you may get a slice from a different part of the pizza, that is, a different rainy season outcome. Martins also emphasized that the models suggested high spatial and temporal variability, addressing common misconceptions held by Dona Maria and others. Rainfall will probably not fall uniformly across Ceará or during the trimester.
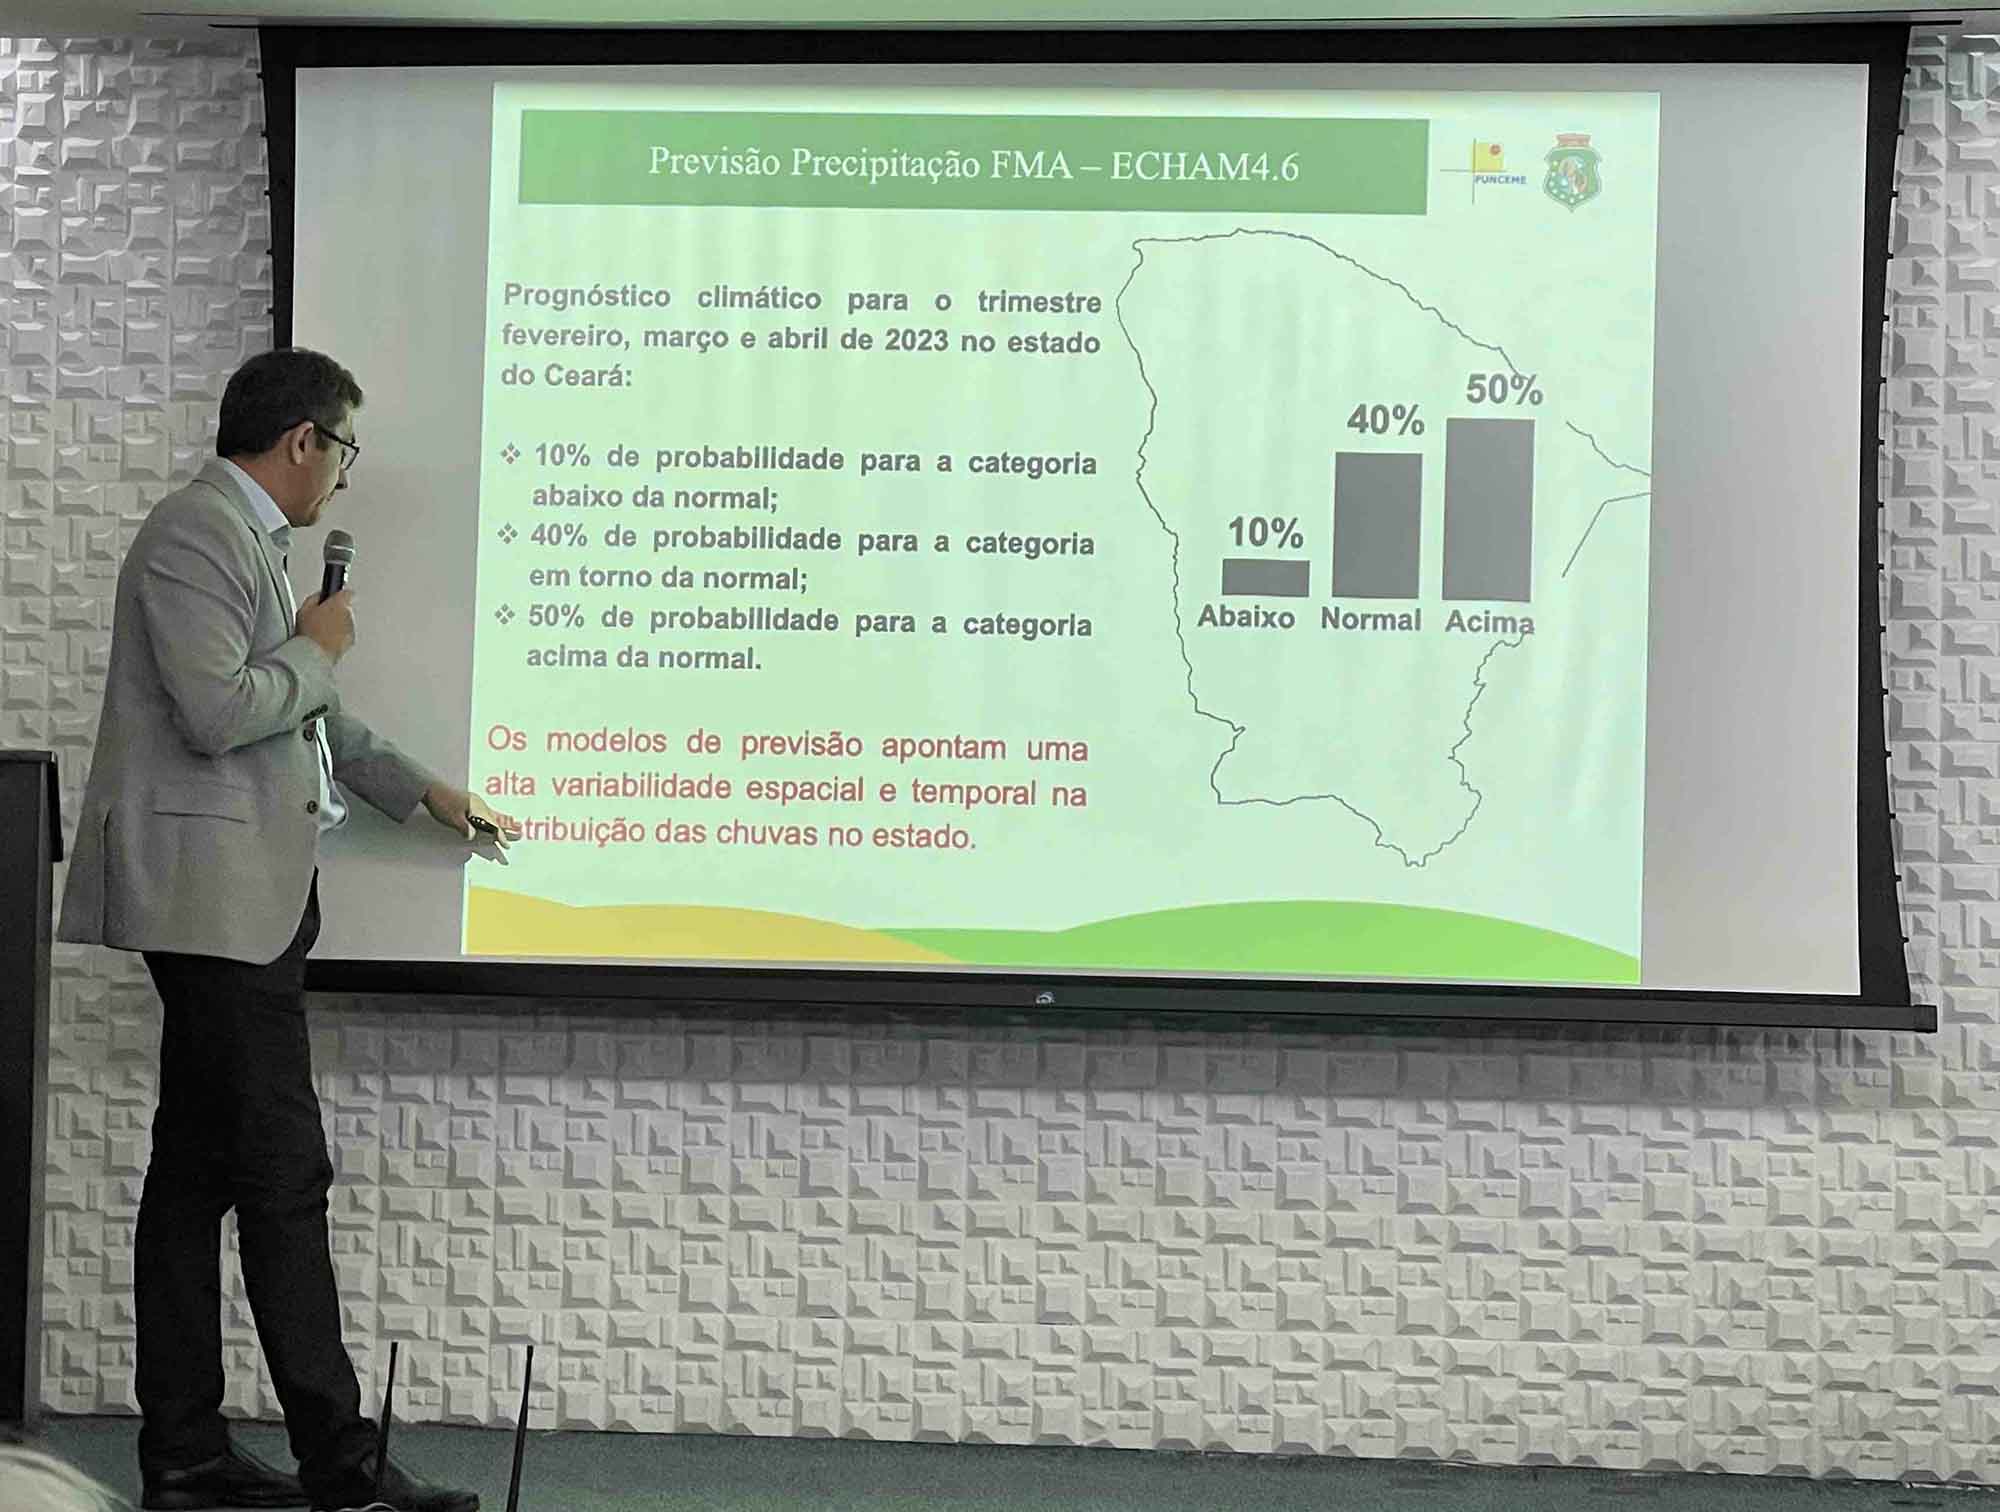
Dr. Eduardo Sávio P. R. Martins, the president of Funceme, presents the seasonal forecast for Ceará for the months of February, March, and April on January 20, 2023. The presentation took place at the Governor’s Palace in Fortaleza, Ceará and was live-streamed by Funceme via Instagram.
Directing perceptions about probabilities during public presentations is one strategy Funceme uses to educate its interlocutors, especially the press. To that effect, Martins beseeched those who were to communicate the forecast to ensure they had these concepts correctly explained before publishing, “So that we [Funceme] don’t have a lot of work later on to, let’s say, redo presentations for other groups to clarify communication problems.”[10] While Funceme’s forecasts are shared via social media, including Instagram and WhatsApp, in addition to newspapers and the radio, there is no guarantee that their complete message reaches or changes perceptions of those living in the sertão.
As a publicly facing research institution, Funceme confronts compound challenges of innovating and communicating those innovations in understandable, useful, and usable ways. Throughout the year, Martins discusses the implications of forecasts and climate trends with different government actors. In mid-March, for example, Martins met with the governor of Ceará and the leaders of various government organs to determine flood-risk areas due to strong rains. Funceme’s forecasts also provide technical experts at the state water management company, Cogerh, a baseline to model water availability in the state’s reservoirs to support bulk-water allocation decision-making by river-basin committees, composed of representatives from civil society, industry, and the government (Lemos et al. 2020).
Funceme, a state institution, also faces the challenge of precarity every four years during the gubernatorial elections. Each election poses the possibility of the reconfiguration of the SRH and Funceme. For two decades, Funceme has experienced relative stability, in part a reflection of the technical competence by Martins, now in his seventeenth year as president. The future of Funceme will depend on its ability to adapt to new leadership, potential political influence, and new environment scenarios in the face of rapidly changing climates.
Acknowledgements
Thank you to Dr. Eduardo Sávio P. R. Martins for his insights, feedback, and collaboration in the development of this research. Also, thank you to Dr. Francisco Vasconcelos Junior and Kim Fernandes for their useful comments on drafts of this post.
Notes
[1] Original: “O problema da Funceme é o seguinte às vezes ele não funciona. Aqui, se eu tenho uma, como é que diz uma previsão da Funceme? Ela pode funcionar lá em outro outro município. Aqui não funciona. Ele prevê uma chuva, por exemplo. Mas aí chove. Lá em Juazeiro do Norte não chove aqui em Piquet Carneiro, chove lá em Barbalha e Várzea Alegre. E aqui nem pinga, né? Então é por isso que eu não dou muita importância, entendeu?”
[2] Individually, the rainy seasons of 2012 to 2018 are ranked better than the tenth most critical year in the history of systematic records, but the persistence of drought reveals a very different drought footprint. See for example:
Martins, Eduardo Sávio P. R., Magalhães, Antônio. R., and Diógenes Fontenele. 2017. “A seca plurianual de 2010-2017 no Nordeste e seus impactos.” Parcerias Estratégicas 22: 17-40.
Martins, Eduardo Sávio P. R. and Francisco de Chagas Vasconcelos Júnior. “O clima da Região Nordeste entre 2009 e 2017: Monitoramento e Previsão.” 2017. Parcerias Estratégicas 22: 63-80.
Escada, Paulo, Caio A. S. Coelho, Renzo Taddei, Suraje Dessai, Iracema F. A. Cavalcanti, Roberto Donato, Mary T. Kayano, et al. 2021. “Climate services in Brazil: Past, present, and future perspectives.” Climate Services 24: 100276.
[3] Original: “crises de ansiedade coletiva em relação à estação de chuvas”; See also: Taddei, Renzo. 2005. Of clouds and streams, prophets and profits: The political semiotics of climate and water in the Brazilian Northeast. Doctoral thesis. Columbia University.
[4] Fundação Cearense de Meteorologia e Chuvas Artificiais and the Fundação Cearense de Meteorologia e Recursos Hídricos, respectively.
[5] Original: “água no sentido geral”
[6] People in the sertão are also inundated with sometimes conflicting rainfall information from a variety of sources—from national agencies to private institutions. This poses a challenge for Funceme to maintain its legitimacy among rural community members, who link conflicting rainfall information from various sources with Funceme because the information is all about rain.
[7] Meteorological drought has been related to anomalies in the Atlantic system, which result in the ITCZ remaining anomalously far north (Hastenrath and Greischar 1993). Meteorological drought is defined as rainfall in the category below the mean. We can imagine having thirty years for which we put rainfall in order from lowest to highest and divide then in the ten years into three categories: The first ten years (below average), the last ten years (above average), and the ten years between these two category, which represent rainfall around the average. The El Niño-South Oscillation (ENSO) and the Madden-Julian Oscillation (MJO) also influence climate patterns at varying temporal scales. See for example:
Kayano, Mary Toshie, and Vinicius Buscioli Capistrano. “How the Atlantic Multidecadal Oscillation (Amo) Modifies the Enso Influence on the South American Rainfall.” International Journal of Climatology 34(1): 162-78.
Vasconcelos Junior, Francisco das Chagas, Charles Jones, and Adilson Wagner Gandu. 2018. “Interannual and Intraseasonal Variations of the Onset and Demise of the Pre-Wet Season and the Wet Season in the Northern Northeast Brazil.” Revista Brasileira de Meteorologia 33: 472-484.
[8] A significant level of subjectivity is added when a group of forecasters determine a single forecast through consensus. In this negotiation process, social and political pressures (e.g., the need to establish a forecast that appeases farmers or state agencies) may drive outcomes. Conversely, objective forecasts are produced directly from the selected models, without a negotiation process.
[9] The superset included a statistical model for Brazil (INMET) and four global atmospheric models (one from Funceme and three from the National Center for Weather Forecasting and Climate Studies). Other projects with sociotechnological significance, including the development of a national drought monitor, attest to the innovative and socially driven character of Funceme.
[10] Original: “[P]ara a gente depois não ter um trabalho muito grande de, digamos assim, de refazer apresentações em outros grupos para esclarecer problemas de comunicação.”
References
Aiello, Giorgia. 2020. “Inventorizing, situating, transforming: Social semiotics and data visualization.” In Data Visualization in Society, edited by Martin Engebretsen and Helen Kennedy, 49-62. Amsterdam: Amsterdam University Press.
Albuquerque Jr, Durval Muniz de. 1994. “Palavras que calcinam, palavras que dominam: a invenção da seca do Nordeste.” Revista Brasileira de História 14 (28): 111-120. [pdf]
—. 2004. The invention of the Brazilian Northeast. Durham: Duke University Press.
de Souza Filho, Francisco. 2018. Projecto Ceará 2050. Fortaleza (Brazil).
Hastenrath, Stefan, and Leon Heller. 1977. “Dynamics of climatic hazards in northeast Brazil.” Quarterly Journal of the Royal Meteorological Society 103 (435): 77-92.
Hastenrath, Stefan, and Lawrence Greischar. 1993. “Further Work on the Prediction of Northeast Brazil Rainfall Anomalies.” Journal of Climate 6 (4): 743-758.
Lemos, Maria Carmen, Bruno Peregrina Puga, Rosa Maria Formiga-Johnsson, and Cydney Kate Seigerman. 2020. “Building on adaptive capacity to extreme events in Brazil: water reform, participation, and climate information across four river basins.” Regional Environmental Change 20 (2): 53.
Marengo, Jose A., Roger Rodrigues Torres, and Lincoln Muniz Alves. 2017. “Drought in Northeast Brazil—past, present, and future.” Theoretical and Applied Climatology 129 (3): 1189-1200.
Morss, Rebecca E., Julie L. Demuth, and Jeffrey K. Lazo. 2008. “Communicating Uncertainty in Weather Forecasts: A Survey of the U.S. Public.” Weather and Forecasting 23 (5): 974-991
Nelson Donald, R., and J. Finan Timothy. 2009. “Praying for Drought: Persistent Vulnerability and the Politics of Patronage in Ceará, Northeast Brazil.” American Anthropologist 111 (3): 302-316.
Seigerman, Cydney K., Raul. L. P. Basílio, and Donald R. Nelson. 2021. “Secas entrelaçadas: uma abordagem integrativa para explorar a sobreposição parcial e as divisões volúveis entre definições, experiências e memórias da seca no Ceará, Brasil.” In Tempo e memória ambiental : etnografia da duração das paisagens citadinas, edited by Ana Luiza Carvalho da Rocha and Cornelia Eckert, 25-54. Brasília: ABA Publicações.
Taddei, Renzo. 2008. “A comunicação social de informações sobre tempo e clima: o ponto de vista do usuário.” Boletim SBMET: 76-86. [pdf]
