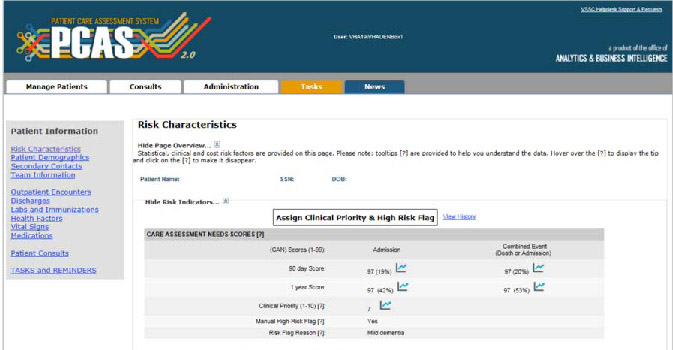
A screenshot of the Patient Care Assessment System dashboard, as it appears to clinicians using it in the electronic health record (Fihn and Box 2016).
By: Peter Taber, Nicholas Rattray, Lauren Penney, Megan McCullough and Samantha Gottlieb
This post emerged from a 2018 Society for Applied Anthropology panel on anthropological engagements with health data in the U.S. Department of Veterans Affairs (VA). Serving over 9 million enrollees with a current federal budget of USD68 billion, the VA is an important testing site for digital healthcare infrastructure, as it has been for several decades. The panel brought our VA research and quality improvement (QI) efforts targeting the electronic health record (EHR) and other digital infrastructure into dialog with existing work on the social lives of data and algorithms, as well as the broader concerns of medical anthropology and STS in an era of the “datafication of health” (Ruckenstein and Schüll 2017). Extracts from our conversation, presented below, are taken from a follow-up video call exploring these issues.
Peter Taber introduced the panel and examined issues related to the governance of antimicrobial prescribing in the VA. His current work examines clinical and epidemiological reasoning surrounding antimicrobial prescribing in the context of organizational initiatives to reduce and manage outbreaks of multi-drug resistant organisms.
Nick Rattray’s case study examined the experiences of stroke neurologists, pharmacists, nurses, and other practitioners with EHR ‘dashboards’, or data displays within the electronic health record, that offered a pass/fail scorecard of providers’ care for patients who have suffered a mini-stroke (sometimes known as transient ischemic attack, or TIA) based on seven required care processes. Considerable labor was necessary to surmount “citadel effects” (Downey and Dumit 1997), or organizational barriers to accessing electronic health data.
Lauren Penney discussed the use of the Care Assessment Need (CAN) score, a predictive metric to identify patients at high risk of hospital readmission.While many primary care nurses found CAN scores useful in highlighting patients who might need more resources, there were practical barriers to using them (e.g. generally no dedicated time for managing panels of patients) and many questions raised about the value added to seeing patterns of risk among patients.
Megan McCollough drew on long-term research studying VA clinical pharmacy specialists (CPS) to describe how they use population health tools, dashboards, electronic medical records, and electronic consults to target bodies not only for detection, assessment and treatment but also to modify health behaviors. The clinical pharmacy gaze is constructed through the application of big data and algorithms to bodies. The effects and consequences of this kind of biomedicalized datafication, saturated in unacknowledged and unconscious social norms, values and governance, bears further investigation.
Samantha Gottlieb was the panel’s discussant. Samantha’s current project explores digital health practices among a community of data-dependent individuals: people living with type 1 diabetes. Her past work has included evaluation of the Center for Medicare and Medicaid Services’ (CMS) pilot program to transition oncologists to value based payments, another data-centric shift that imagines data as liberating, without fully considering the impact on those who must implement the change.
“Data as Savior”
Nick: Early on in our study of the TIA dashboard, there was very clear reliance on numbers: the key statistic given repeatedly was that early intervention with TIA patients can reduce the rate of subsequent adverse events by 70%. This drastic reduction in risk is rare in healthcare, and was one of the selling points for encouraging VA facilities to participate.
“Data as savior” here means that only through the quality dashboard do local VA hospitals have access to TIA performance data. The pitch for the TIA dashboard was that participation would grant access to a data source that is extracted, polished and cleaned from the Corporate Data Warehouse (CDW; the major VA data repository). This is where the “citadel effect” matters: although the CDW theoretically offers a deluge of data from the EHR, in practice a range of cultural and technical barriers prevent most potential users from making sense of these data. Data scientists and epidemiologists must clean the data for you; they act as “data brokers” that un/intentionally limit access.
The issue for me here is that viewing “data as savior” depends on who it’s saving: is it for the patients? Is it to help clinicians? Central Office policy makers? As critical data studies scholars argue, situating each case within its political context, in time and space helps us expose how data is never “raw” or capable of “speaking for itself.” (Kitchin and Lauriault 2014)
Pete: Data is seen as savior when it’s data that you don’t have. Ironically, in your case it’s actually data that’s being produced by your facility, but you have to work through a series of data brokers to get access to it and utilize it to improve healthcare. That’s maybe an endemic feature of the centralization imposed by a “data warehouse”.
The Patient as Source and Target of Data-Driven Interventions
Meg: There’s also this creation of the fiction that we call “the patient”, who’s in need. I think that’s an imagined being at the end point of a funnel – the whole “data funnel” is coming straight for the patient. It may be good for them. It may not. Hard to know.
Lauren: Thinking about that funnel directing attention towards a certain type of imagined patient, when we talked to providers about their use of the CAN score we found a lot of pushback against where the funnel was pointing their attention. Providers noted the high scorers might fall on and off the list based on how the score was derived (i.e. they thought these were not truly or consistently high-need patients). Or the high-risk patients were already known, or were already receiving all the services they could offer. Providers also talked about how their clinical judgement was better informed by understanding patient histories and context. They felt the score did not really add to what they were doing, and maybe detracted from, or cheapened their ability to recognize the patterns of risk through their personal and longer-term relationships. At the same time, some primary care nurses described high scores as a signal which brought patients to their attention so that they could take a deeper dive into patients’ charts to understand what was going on.
Samantha: Beyond the VA, the U.S. Federal Drug Administration has been expanding their process of trying to bring in patient preferences into their regulatory assessments. Patient preference initiatives (PPI) for clinical trial data and patient reported outcomes (PROs) create new categories to incorporate the data that still may fall through (see U.S. Food and Drug Administration 2019). When the patient is this end point, whether you’re in the VA or outside of the VA, there’s this fantasy patient who generates data. What I’ve been calling the “fantastical empowered patient” is this imagined recipient who is to be compliant, agreeable, a utopic patient.
I think that these categories of trying to use data to imagine the patient – it’s such an abstraction and there is also the problem of not really knowing what to do with the messiness of patients’ collected/generated data. Nick was mentioning how much data needs to be cleaned; we have to manipulate and manage and massage data to get it to fit into what we need it to do when we’re doing large data analyses. How do the patients’ data ‘fit’ what is needed from the data?
Data Interpretation and the Politics of Metrics
Nick: How do clinicians – who may or may not have a research background, or even have an affinity for numbers – how do they interpret performance metrics and clinical dashboards?
Meg: It’s lovely to have this whole evidence-based medicine movement, but evidence for a lot of doctors to me seems very rooted in complex, nuanced, layered belief, and their own sense of themselves. So when the data says “You’re not doing it right,” I have watched that be very hard for people to absorb. We have all seen people respond by saying “The data is wrong.” That’s not true, and yet you know that the data really is messy and people made tons of decisions about how to clean it and get it into the dashboard. Being on the receiving end of data that says that you are over-prescribing opioids or inappropriately prescribing pulmonary hypertension medication is very difficult.
Nick: One aspect of the TIA study was a moral component that underlies most VA studies: a narrative of deservedness. It surfaces in queries like, “Don’t you agree that every veteran deserves all seven processes [measured in the TIA dashboard]?” Why wouldn’t you, right? The point here is that metrics and dashboards (and QI projects more broadly) are internally “marketed,” and that as such they are sites of tension and multiple strands of representation.
Samantha: It sounds like it’s eliminating nuance or ignoring the fact that almost no one can hit the seven out of seven TIA quality measures. And yet, a clinician shouldn’t just give up on their patient because they haven’t met all seven criteria. If those criteria are impossible, then what? Presumably the patient continues to get treatment, but what are the implications of being an exception in the system, even if exceptions are the norm?
Research and Quality Improvement in the VA
Pete: There are so many different pathways in the VA whereby quality metrics can be taken up. For high profile problems, maybe it is driven by Central Office. But then there are also quality metrics like Nick is talking about where it emanates from a particular medical center. I was on a system-wide quality project where local clinical leaders were very involved in designing the standards to be implemented, and in some cases contesting them – aware that certain ways of measuring things are going to impose greater burdens in terms of data management, either on them or people in their service lines; potentially alter the focus of care in both intended and unintended ways; and they are also aware that they are being asked for transparency that is not demanded of private sector providers. So quality metric design is not necessarily blackboxed from the larger organization, and is often a focus of widespread negotiation.
Nick: There’s a bit of a survival of the fittest with the quality measures. It’s not set in stone which measures matter. It depends on leadership, which turns over. I haven’t been around the VA long enough to see a lot of changes, but to me there’s an environment of competition. Even the VA’s paradigm of investigator-initiated research creates pretty stiff competition, and some of these quality measures come out of that environment.
Meg: If a medical center or local group develops performance metrics, they can do innovation grants, “Shark Tank” competitions [for investment in entrepreneurial projects], diffusion-of-excellence projects – so it brings prestige to your medical center, and to your Veterans Integrated Services Network [regional VA division].
Citations
Downey, G. L. and J. Dumit
1997 Cyborgs and citadels: Anthropological interventions in emerging sciences and technologies. Santa Fe, NM: School of American Research.
Fihn, S.D. and T. Box
2016 Update on the Care Assessment Need Score – CAN 2.0 and the Patient Care Assessment System (PCAS). VA Health Services Research & Development Cyberseminar January. Online document, https://www.hsrd.research.va.gov/for_researchers/cyber_seminars/archives/1088-notes.pdf, accessed June 9. 2019.
Kitchin R. and T Lauriault
2014 Towards critical data studies: Charting and unpacking data assemblages and their work. In Geoweb and Big Data. Eckert, J., Shears, A. and Thatcher, J. (eds) University of Nebraska Press.
Ruckenstein M, and ND Schüll
2017 The datafication of health. Annual Review of Anthropology 46: 261-278.
U.S. Food and Drug Administration
2019 Learn about FDA patient engagement. Online document, https://www.fda.gov/patients/learn-about-fda-patient-engagement#deviceppi, accessed June 3, 2019.
